Explore Our Resources
Interactive Map
Visualize monthly carbon flux data across the Arctic on an interactive map.
Data Download
Access and download the complete dataset for your own research and analysis.
About the Project
Learn about our mission, the team, and the scientific methods behind this work.
Near-Real-Time Air Temperature
Daily Global Mean Near-Surface Air Temperature (ERA5)
Loading data...
Our Partners
Funding Partners
Data & Research Partners


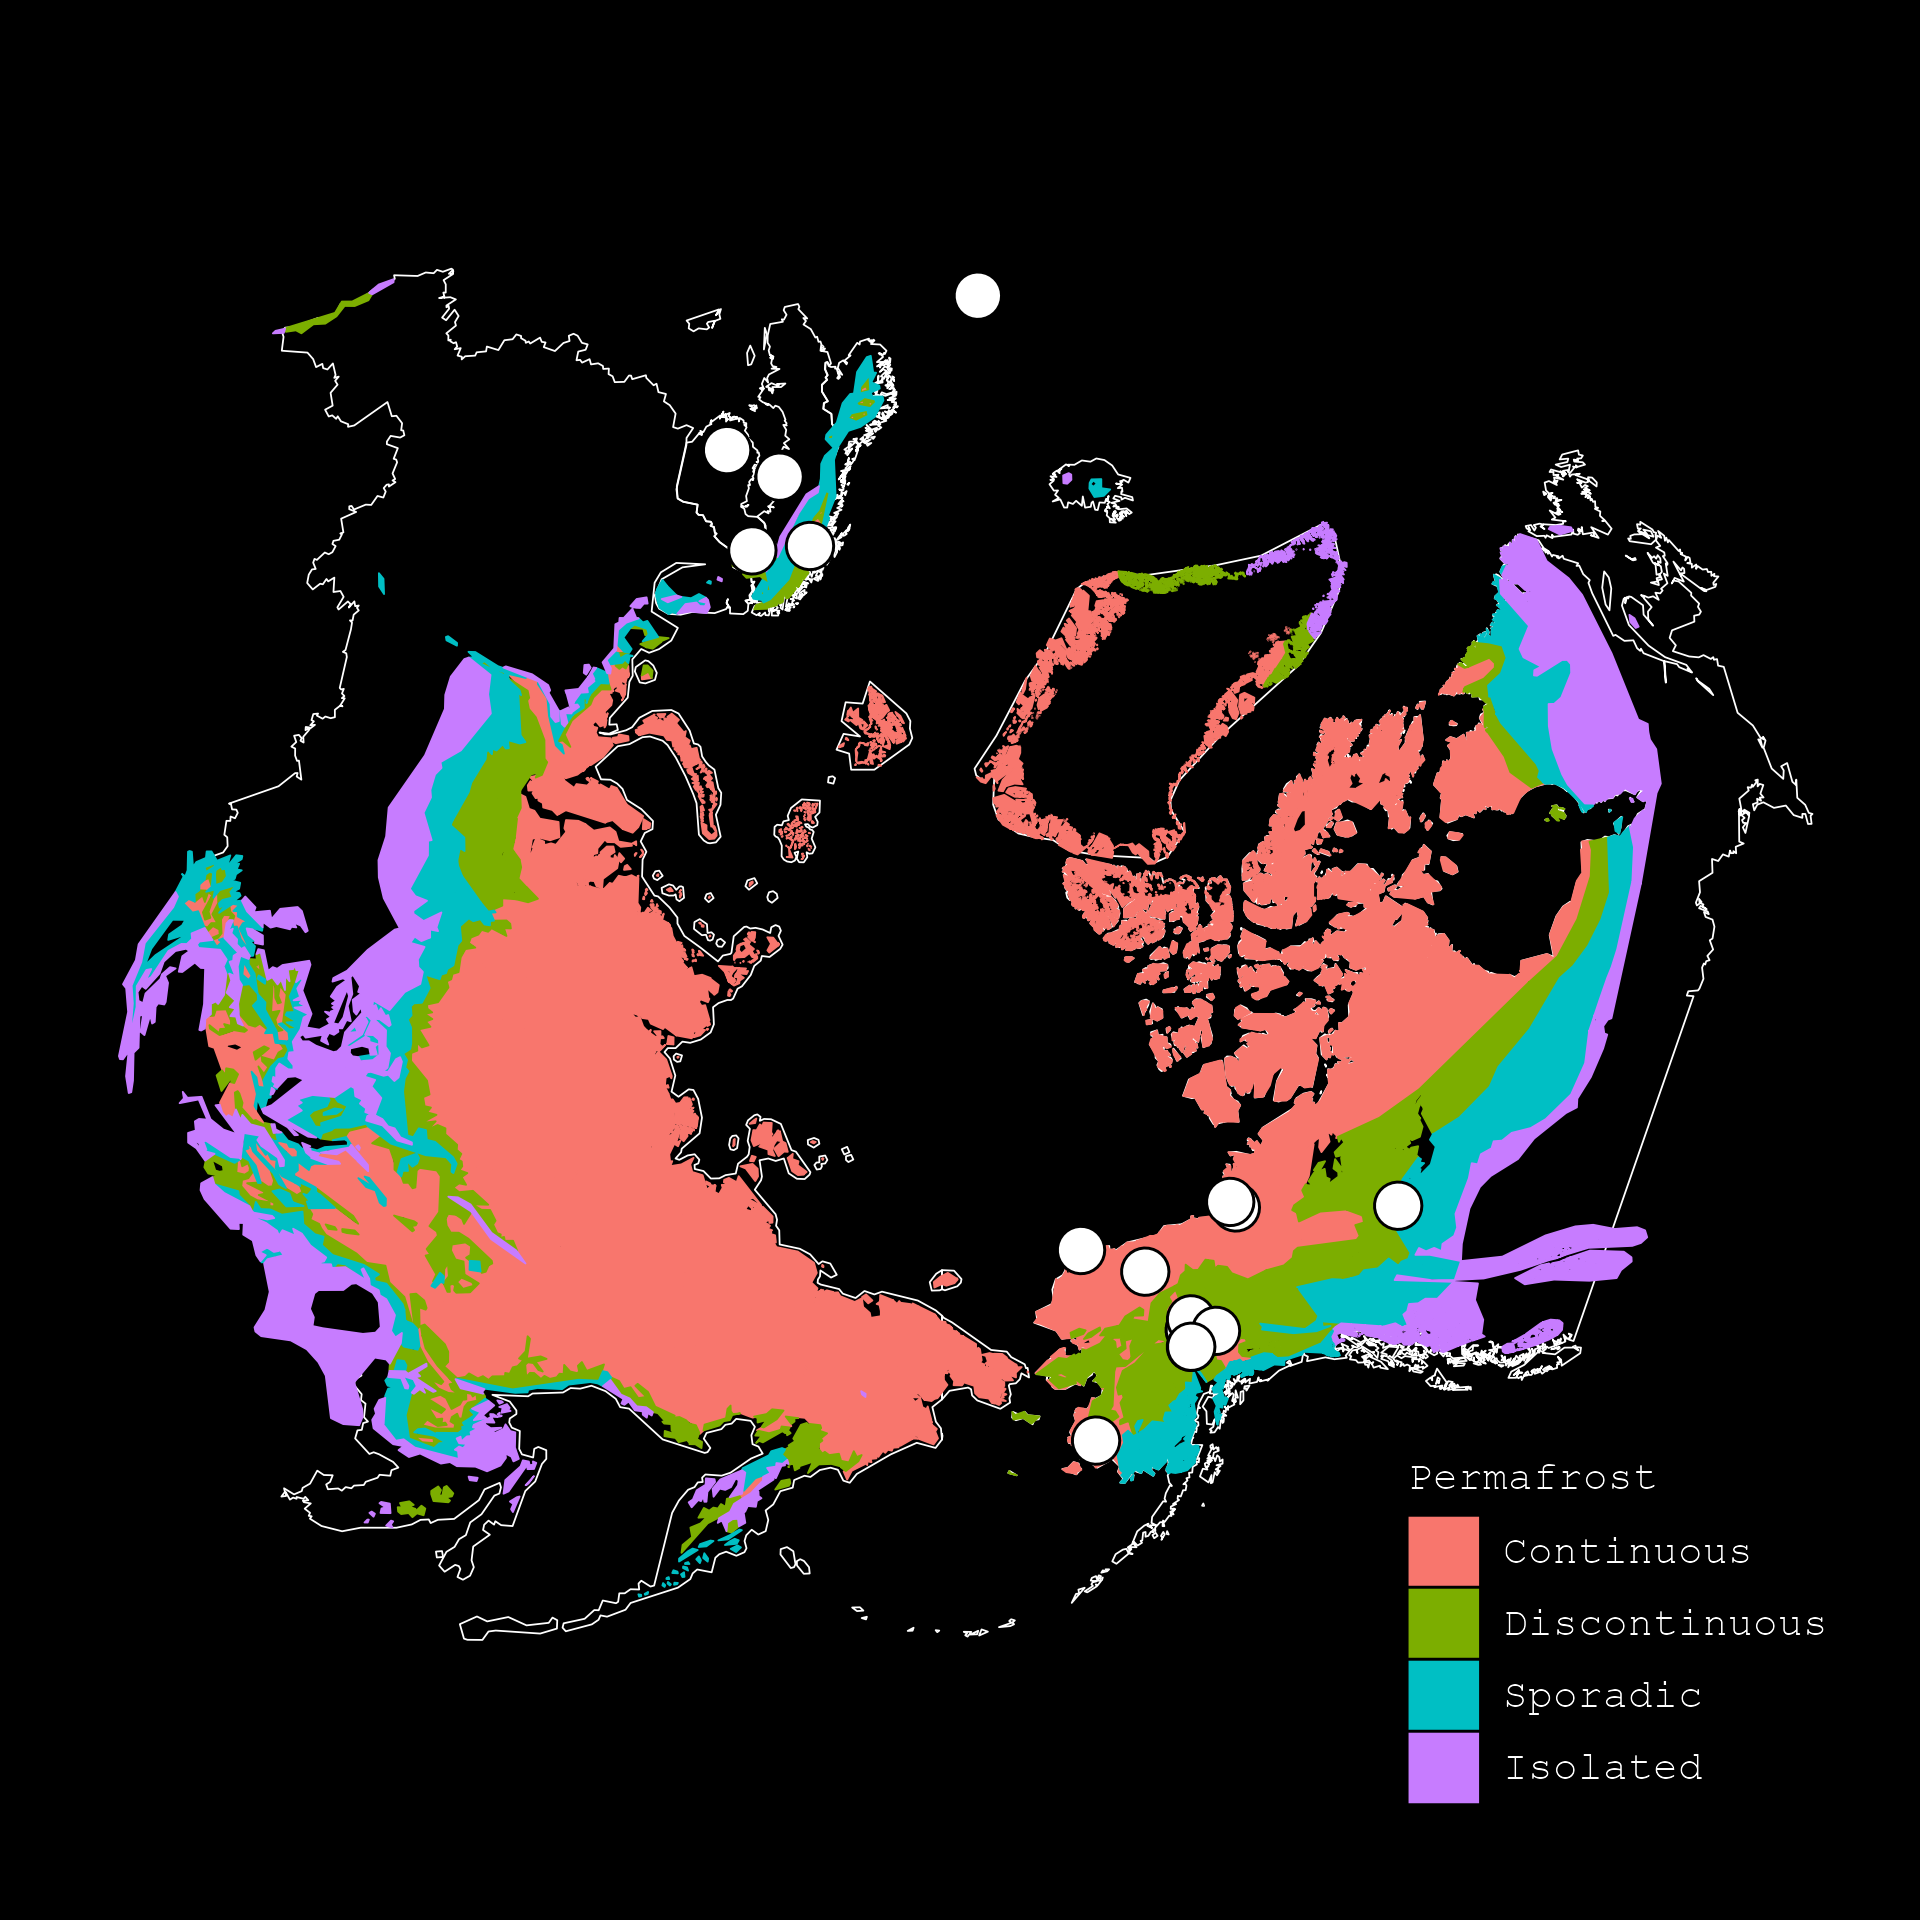
Carbon Flux Monitoring Site Map
The EcoCarbonMonitor model has been validated against a network of eddy covariance flux towers across the Arctic-Boreal region. This map shows key sites providing the ground-truth data essential for calibrating our landscape carbon flux estimates.
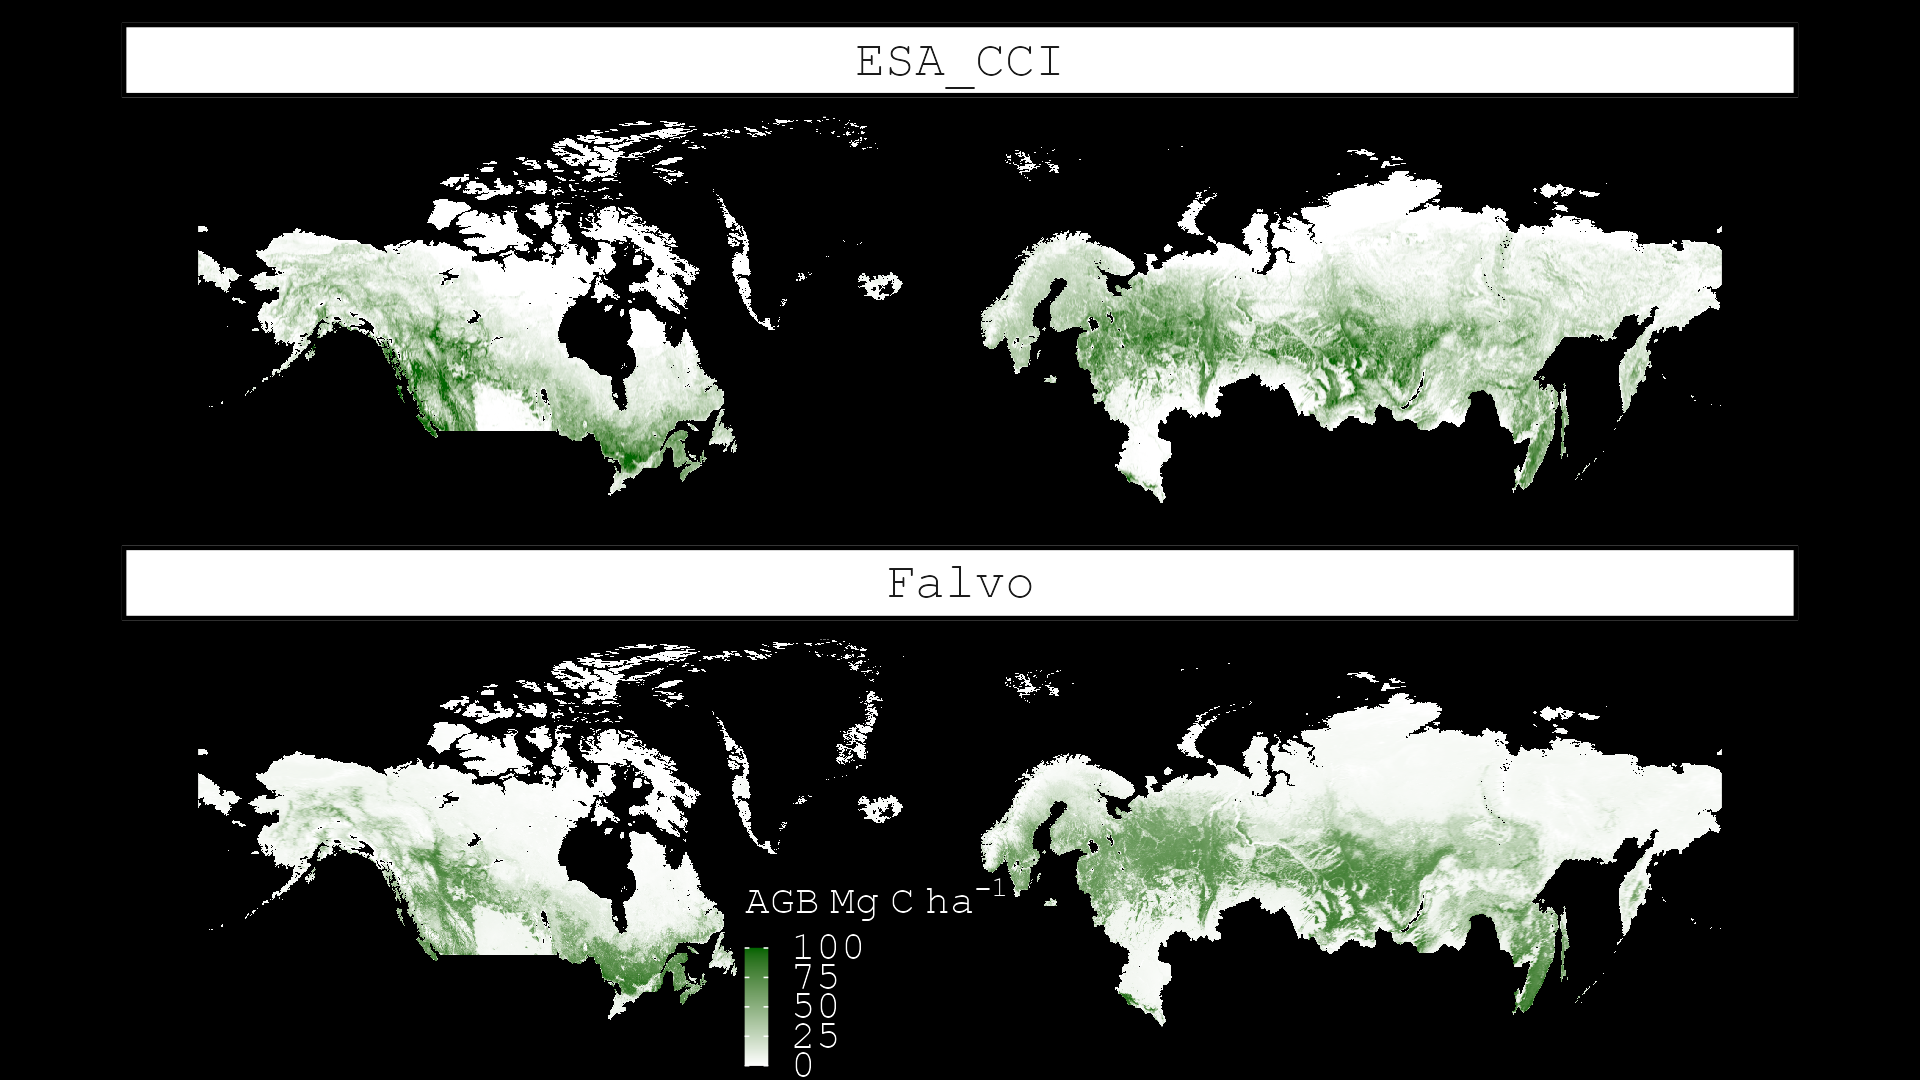
Model Comparison
EcoCarbonMonitor estimate of above-ground biomass with independent datasets. Strong agreement with established benchmarks demonstrates the robustness of our modeling framework.
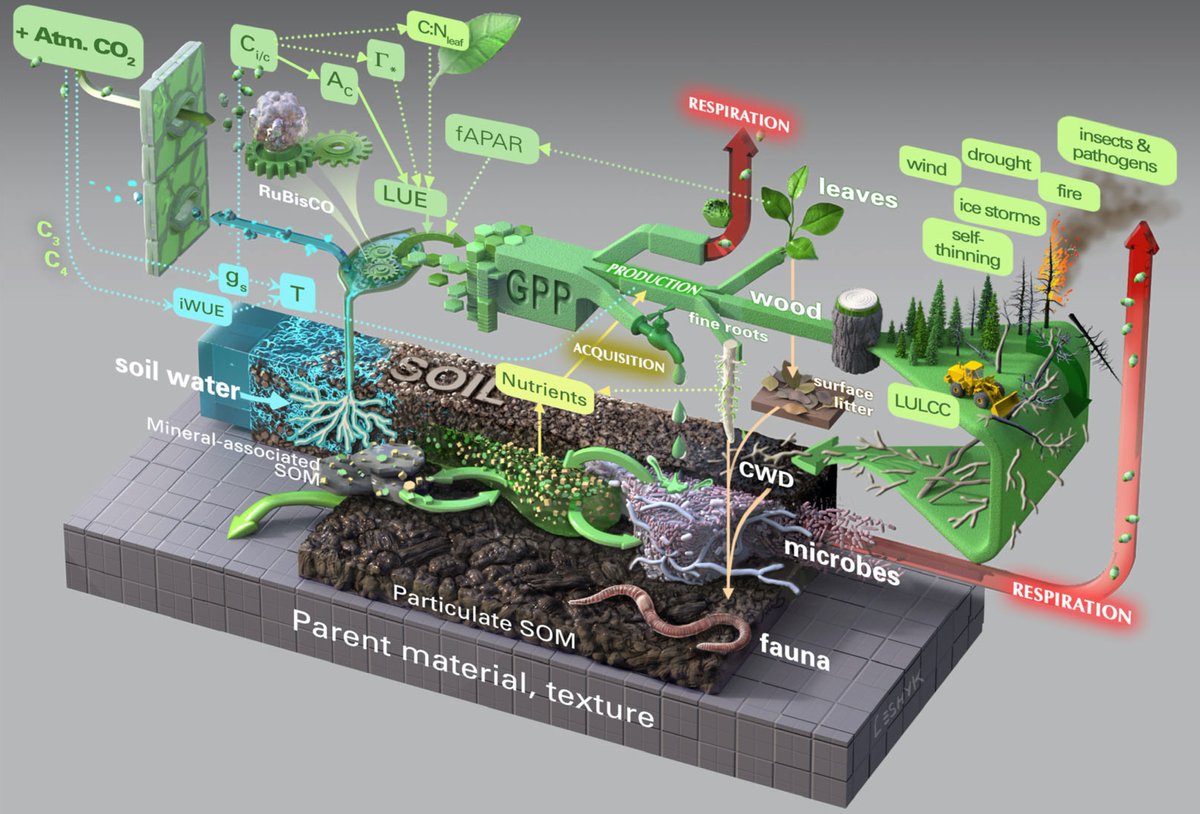
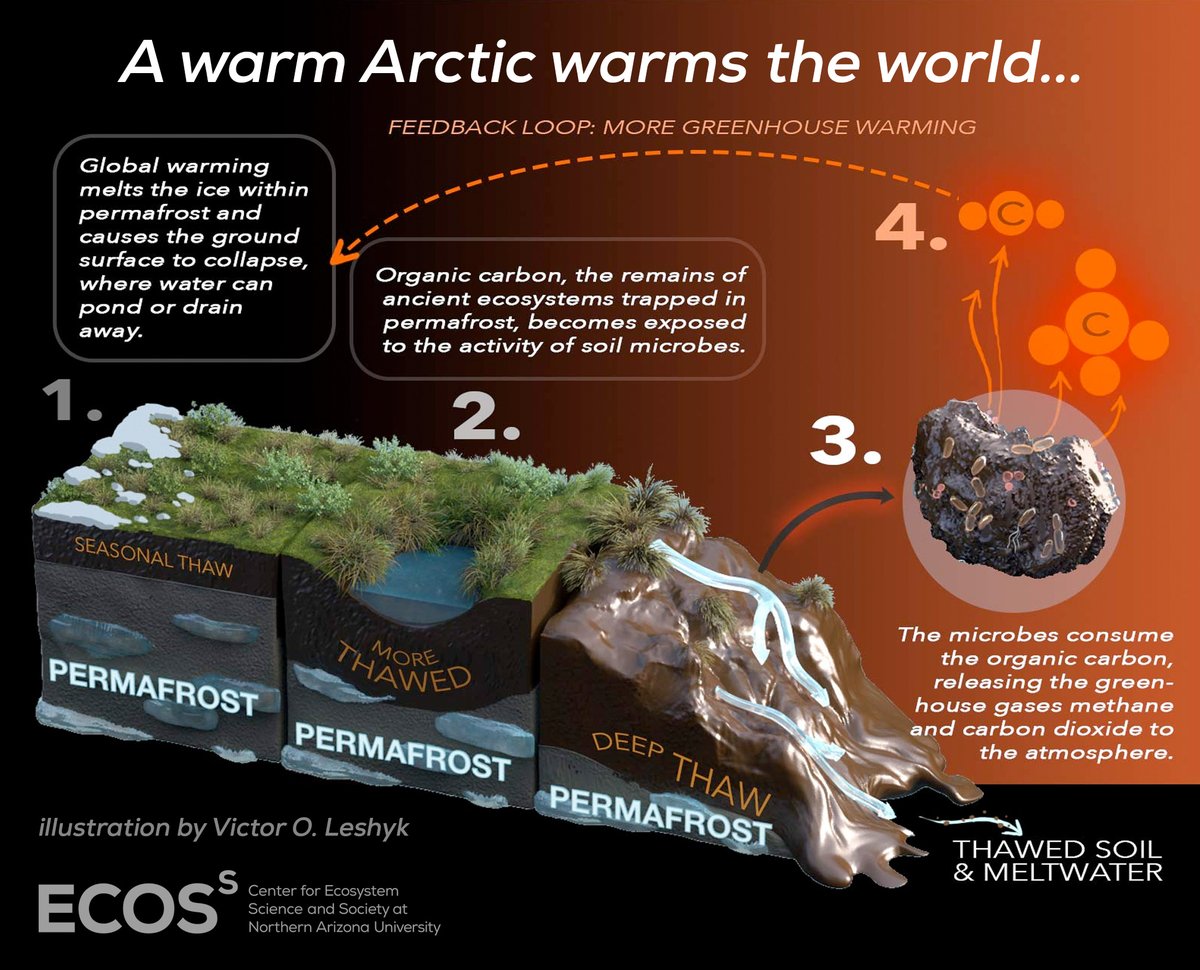
Featured Artwork